In this blog for Vision: 2025’s Earth Day Special newsletter, Tim Benson, Chair of Powerful Thinking shares findings from his journey through Electricity Maps, an interactive, open-source App that ranks countries by the carbon intensity (gCO2e/kWh) of the electricity it consumes. He gives us an overview of how the UK compares to other countries and trends in growth in different renewable sources, from Solar PV to wind, hydropower and bioenergy:
Do you ever lie in bed on a sleepless night and wonder where you could run your live event without feeling guilty about your contribution to greenhouse gas emissions? No, maybe, yes!! – well, fret no more, because now all you need to do is grab a cup of cocoa and visit: https://app.electricitymaps.com/map
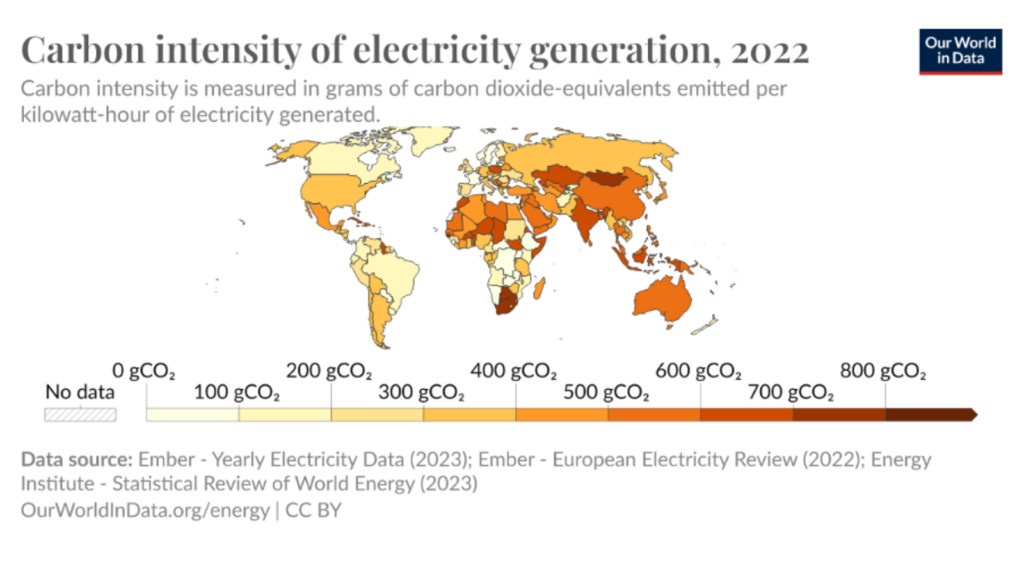
Electricity Maps is an interactive, open-source App that ranks countries by the carbon intensity (gCO2e/kWh) of the electricity it consumes. It’s a fairly crude tool but quite eye opening at the same time; in fact, so much so, that it led me to pen this piece for our Vision2025 Earth Day Special newsletter.
By the end of 2022, global renewable generation was estimated at 3,372GW. Solar PV is currently the fastest growing renewable source, with wind second, hydropower third and bioenergy bringing up the rear. According to the International Energy Agency (IEA), solar will eclipse all other renewables and account for 60% of every new power installation in the next five years.
In 2023 28.1% of global energy production was derived from renewables. Hydropower, including pumped storage, remains the most prevalent of these, accounting for 37% of total generation, with solar second at 31%, wind third with 27% and others (bioenergy, geothermal and marine) at 5%. Analysts expect renewables to become the largest source of energy generation by 2027, with a 35% contribution to the world energy mix.
Iceland remains the only country considered to run 100% from renewables – in 2020 only 0.0001% of its energy generation came from conventional fossil fuels. Norway and New Zealand aren’t far behind, at 99% and 80.9% respectively. In terms of regions, Latin America leads the world in clean energy usage, with 57.5% of its energy mix delivered through renewables; Europe sits in second place at 40.7%, whilst unsurprisingly the Middle East comes in last at only 2.2%.
In 2023 the UK broke a number of its own key records in terms of its own zero carbon generation. It was the greenest year ever, with an average carbon intensity of 149g of CO2e per kWh and, quite amazingly, this figure fell to just 27g on 18th September. On average 51% of the UK’s electricity was delivered through zero carbon sources, with a staggering record set on 4th January as this rose to 87.6%.
A large proportion of this increase is attributable to the deployment of wind and solar. On 19th November, between 04.30 and 05.00 hours, wind power’s share of the UK energy mix climbed to a record 69%, whilst on 21st of December it accounted for a record 21.8GW of discrete generation. Solar generation has been setting its own records too, with a gargantuan 10.971GW of production recorded on 20th April the same year.
According to data from the Department for Energy Security and Net Zero, UK demand fell by 7.2% between 2022 and 2023. This reduction is likely attributable to a sharp global rise in energy costs driven by international conflicts, but also because we are becoming more genuinely energy savvy. We cannot rely solely on advances in generation, storage and transmission technologies to save our planet, without some recognition of the part we play as consumers. This means compromise and common sense are needed in equal measures if we are to fully harness and unleash the true power of nature. Happy EarthDay to you all!
This guest blog originally appeared in the April 2024 Vision: 2025 newsletter. Sign up to receive monthly event sustainability news, case studies and guest blogs direct to your inbox www.vision2025.org.uk